Uptime monitoring with a safety net

It watches everything,and fixes what it can.

Ponos checks your sites, APIs and infrastructure from around the world. The moment a deploy makes things worse, it can roll the release back or run a recovery step you approved, then tell you it already handled it. Most outages close before anyone opens a laptop.

30s
checks from multiple regions
Auto
rollback on a bad deploy, with guardrails
1
status page your users can trust
api.northwind.ioRecovered

99.96%

Uptime 30d

214ms

Response

2,880

Checks/day

Timeline

02:58Error rate on /checkout jumped to 18% after deploy a1f9c2e.
02:58Ponos matched the regression to that release and rolled it back automatically.
02:59Error rate back to 0.2%. Team notified in Slack. No page sent.

How it works

From a failing check to a healthy system, on its own

01

Watch from everywhere

Ponos checks your endpoints from several regions as often as every 30 seconds, and learns what normal latency and error rates look like for each one.

02

Catch the regression, find the cause

When health drops, Ponos knows it is a real regression, not a blip, and lines it up against your recent deploys and config changes to pin the likely trigger.

03

Act, within your guardrails

If a deploy is the culprit, Ponos rolls it back, or runs a recovery step you approved. It only takes actions you have allowed, and every action is logged.

04

Confirm and report

Ponos verifies health has recovered, updates your status page, and posts what happened to your team, with a postmortem draft ready to edit.

Capabilities

A monitoring platform, not just a ping and a red light

Ponos covers the whole loop: notice the problem, understand it, fix what it safely can, and keep everyone informed. Here is what is in the box.

Automatic rollback of bad deploys

When a release clearly makes health worse, Ponos reverts it without waiting for a human. It confirms the regression, ties it to the exact deploy, rolls back, then checks that recovery actually happened. You wake up to a note, not an outage.

error ratelatencystatus codesdeploy idconfirm healthy
Guardrails you control

Ponos never does anything you have not allowed. You decide the boundaries, and it stays inside them.

  • Read-only until you enable an action
  • Require confirmation for risky steps
  • Every action logged and reversible

Safe by default. The automation is a helper, not a loose cannon.

Global uptime and latency checks

HTTP, API, ping, TCP port, keyword, and SSL-expiry monitors from multiple regions, as often as every 30 seconds.

AI regression detection

Learns each endpoint's normal behavior and flags real slowdowns and error spikes, so you get fewer false alarms.

Recovery runbooks

Beyond rollback: restart a service, scale up, fail over, or disable a flag. You define the steps Ponos may run.

Smart alerting and on-call

Slack, webhook, email and SMS, with alert grouping and escalation so one bad deploy is one incident, not forty pages.

Public status pages

A hosted status page on your subdomain, updated from live monitor state, with incident history and uptime SLAs.

Incident timeline and postmortems

Every incident gets a timeline of what happened and what Ponos did, plus a draft postmortem written while it is fresh.

Visual workflows

Own your post-deploy steps on a canvas

Recovery is only half of it. Ponos lets you design the whole post-deploy flow visually, so the automation that keeps you up is something your whole team can read, change, and trust.

Build it by dragging, not scripting

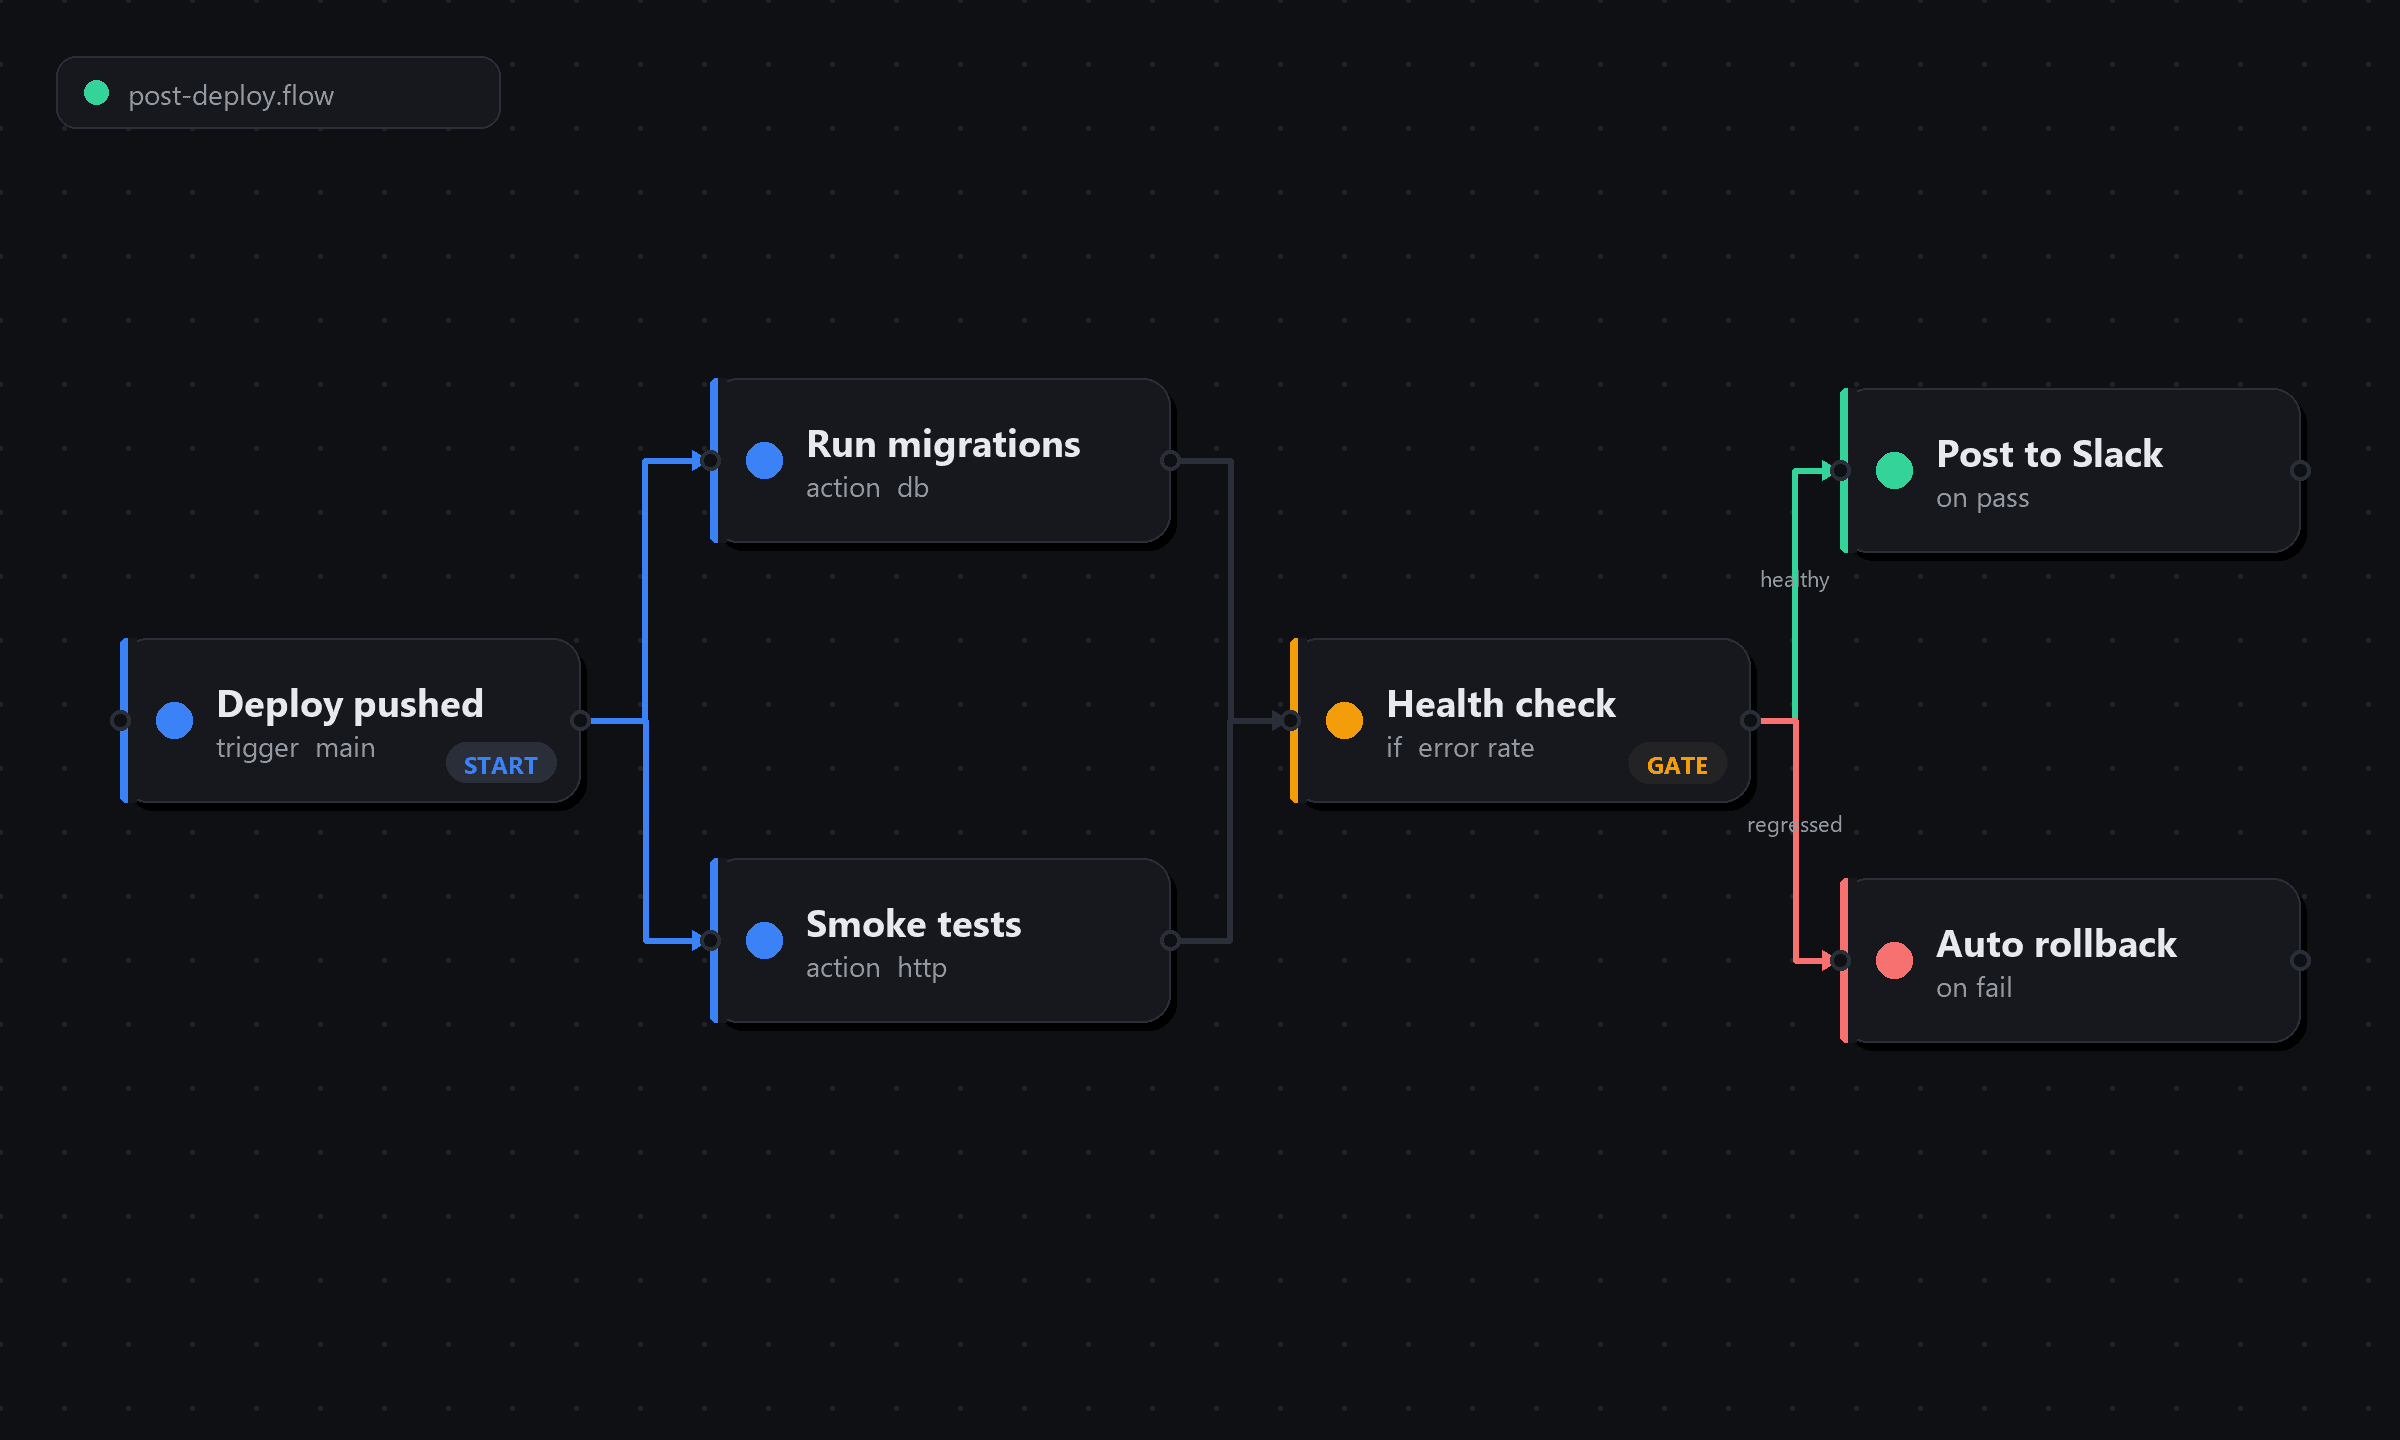
Wire up what happens after a deploy on a visual canvas: run migrations, warm caches, hit smoke tests, notify the team. No YAML to babysit.

Branch on real health

Add a health gate and the flow splits on live signals. Healthy goes one way, a regression triggers the rollback path automatically.

See what actually ran

As AI writes more of your code, the deploy step is where visibility slips. The canvas shows every action, in order, with its result.

See how a flow runs
post-deploy.flow
A Ponos post-deploy workflow on the visual canvas: a deploy trigger runs migrations and smoke tests, a health check gate then branches to a Slack notification when healthy or an automatic rollback when a regression is detected.

Pricing

Pricing that grows with your uptime needs

Start free and move up when you need faster checks, automatic recovery, and room for a bigger team. No per-seat surprises.

Starter

Freeforever

For a small service or side project you want to keep online.

Start free
  • Up to 10 monitors
  • Checks every 60 seconds
  • 1 status page
  • Email and Slack alerts
  • 7 day history
Most popular

Growth

$49per month

For a team running real production traffic that cannot go down quietly.

Request access
  • Up to 100 monitors
  • Checks every 30 seconds
  • AI regression detection
  • Automatic rollback and recovery runbooks
  • Unlimited status pages
  • On-call scheduling and escalation
  • 90 day history

Scale

Let's talkcustom

For larger teams with strict uptime targets and compliance needs.

Book a walkthrough
  • Unlimited monitors
  • Custom check regions and frequency
  • SSO and audit logging
  • SLA reporting
  • Priority support
  • Security review and DPA

Every plan includes global checks, public status pages, and the guardrails that keep automation safe.

Roadmap

What is live, and what we are building next

Monitoring, status pages and alerting are live and running in production today. The self-healing automation is rolling out now, and we are being careful to get the guardrails right before the automation goes wider.

  1. Shipped

    Global uptime and latency monitoring

    HTTP, API, ping, port, keyword and SSL-expiry checks from multiple regions, with response-time history and configurable alerting.

  2. Shipped

    Status pages and smart alerting

    Hosted public status pages driven by live monitor state, plus Slack, webhook and email alerts with grouping so one incident is one notification.

  3. Building now

    AI regression detection and deploy correlation

    Learned baselines that separate real regressions from noise, tied to the specific release or config change in the blast window.

  4. Building now

    Automatic rollback and recovery runbooks

    Safe, guardrailed remediation: revert a bad deploy or run a recovery step you approved, then confirm the system is healthy again.

  5. Planned

    Multi-step browser checks and SLA reporting

    Synthetic checks that click through a real user flow, plus scheduled SLA and uptime reports you can share with customers.

Company

A small team that thinks an alert should come with a fix

Most monitoring tells you something is wrong and stops there. The pager goes off, someone scrambles, and half the time the answer was simply that the last deploy was bad. We think the tool that noticed the problem is often in the best position to undo it, safely, so a two-hour outage becomes a two-minute footnote.

We build with an AI-first workflow ourselves, from spec to shipped code, which is exactly why we care about automation that shows its work and stays inside the limits you set.

We got tired of watching dashboards

Ponos comes from the experience of staring at a red graph at 3am, knowing exactly which deploy did it, and still having to fix it by hand. So we taught the monitor to help.

Automation with a seatbelt

Software that acts on your infrastructure has to be trustworthy. Ponos is read-only until you say otherwise, asks before risky steps, and logs everything it does.

Building in the open

We ship continuously and say plainly what is live versus what is coming. The roadmap and changelog are the real state of the product, not marketing.

Start monitoring in minutes

Create your account, add your first monitor, and put a status page live today. The Starter plan is free, no card required.

Questions first? Write to hello@ponos.in

No spam. We use your email only to set up your account and send updates you asked for.